Services in Citrix ADC / NetScaler “know” if the server in the back-end is up and running, or not. So a green sign in the Status column means: Everything is fine, the (web)-server is OK.

How does it know? There is a monitor attached. You may find a list of built in monitors at Traffic Management → Load Balancing → Monitors.
There are 2 default monitors:
- ping-default: by default used with non-TCP based services. It sends an ICMP ping and expects an ICMP reply.
- tcp-default: by default used by TCP-based services. It sendsa a SYN, expects a SYN/ACK and closes sending a RESET
There are several protocol-specific monitors:
- arp (sending ARP requests. Mainly used to loadbalance non-pingible firewalls)
- ping (similar to ping-default, but configurable)
- tcp (similar to tcp-default, but configurable)
- tcps (creating a TCP connection, a SSL session and tearing the connection down)
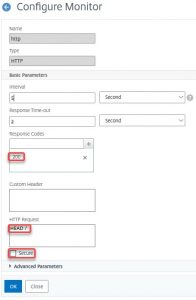
- http (sending a HEAD / and expecting a 200 OK)
- https (similar to http, but using SSL in addition)
There are some more specific ones, needing configuration:
- dns (doing a DNS lookup. Specify a hostname and a corresponding IP address)
- ftp (logging on to an FTP server)
There are extended content verification monitors
- tcp-ecv (sends configurable data to a TCP based server and expects a configurable reply)
- tcps-ecv (similar to tcp-ecv, but using SSL)
- http-ecv (sending an HTTP request and checking for a string in reply)
- https-ecv (similar to http-ecv, but using SSL)
- udp-ecv (sends configurable data to an UDP based server and expects a configurable reply)
- MS-SQL-ECV (sends a SQL command and expects configurable a reply)
- MYSQL-ECV (sends a SQL command and expects configurable a reply)
- ORACLE-ECV (sends a SQL command and expects configurable a reply)
There are monitors, based on pearl-scripts. Non of these are visible, instead, you have to click add and select a template
- .
- LDAP (sending LDAP commands)
- POP3 (initiating a POP3 communication)
- SMTP (initiating a SMTP communication)

Different to all other monitors, these monitors send probes from NSIP if any possible, not from SNIP. The reason is pearl-engine. It has been implemented in BSD, not in NetScaler OS.
We propose, not to use any of the built-in monitors, using copies instead. The reason is, someone might change settings and therefore, by mistake, break your deployment.
The HTTP and HTTPS monitor
The HTTP monitor sends the HTTP Request string (per default HEAD /) to the server and expects the Response Code in the reply. If you check the secure box, it will change to an HTTPS monitor.
This is a basic monitor, there is hardly any point in changing it. An exception is a service like Microsoft Exchange®. Exchange services have a virtual file called healthcheck.htm. This file exists in memory and is only available if the service is up and running. If you want to check OWA, you would replace HEAD / with GET /owa/healthcheck.htm. The reply has to be a 200 OK (meaning the file is there).
Lab:
Assign the HTTP monitor to the red service. Check the status of the monitor.


The above screen shot shows clearly: There had been a response (so don’t even think of a firewall issue) but the server responded with a response code different from 200 OK.
You should try reproducing this issue by editing the HTTP Request string to GET /dontexist.php, a file that does not exist.
The HTTP ECV monitor
The HTTP ECV monitor is way more skilful. It does not simply check for the existence of a file, instead it checks the content of a file. Let’s have a closer look at it.
Have a look at my red test page (/red.htm). There is some content of course.
if you see this you are connected to blue server, 93.83.148.44

Ing. Johannes Norz
Beethovengasse 2/6, 2500 Baden / Austria
http://www.norz.at

Home
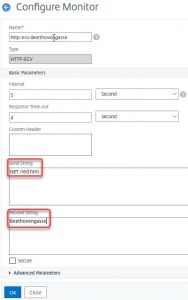
Let’s pick an unusual word, a word that’s typical for this page. Let’s say, Beethovengasse. Our ECV monitor will check for the existence of this word.
Lab 1
Create a monitor like that and assign it to the blue service.

Change the receive string (I appended an X)

Again, you can see: TCP-connection successful (no firewall issue!), HTTP response received (HTTP daemon is up), but HTTP response did not contain the data we expected.
What, if this Monitor does not work?
Sometimes this monitor does not work, both for HTTP-ECV and HTTPS-ECV. What could go wrong? You send a request and expect a response to come back.
This will most likely happen in an environment with several HTTP services on one IP:Port. So the server has to distinguish between virtual HTTP services based on the host header. CTX 126037 gives a good explanation on how to deal with this issue.
So the solution is, to provide a host header. So we have to add a host header to our request.
Lab 2
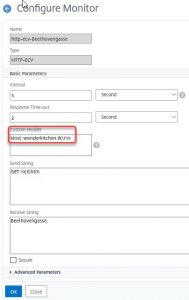
Bind the same monitor to the green service. The green service shows down. It needs to see a host-header for “wonderkitchen.tk”
Open this HTTP-ECV monitor.
Add the string Hostz: wonderkitchen.tk\r\n to the Custom Header field. \r means carriage return, \n means line feed. So this host header has to be followed by a new line command.
[wpedon id=”798″ align=”center”]


